Dashboard
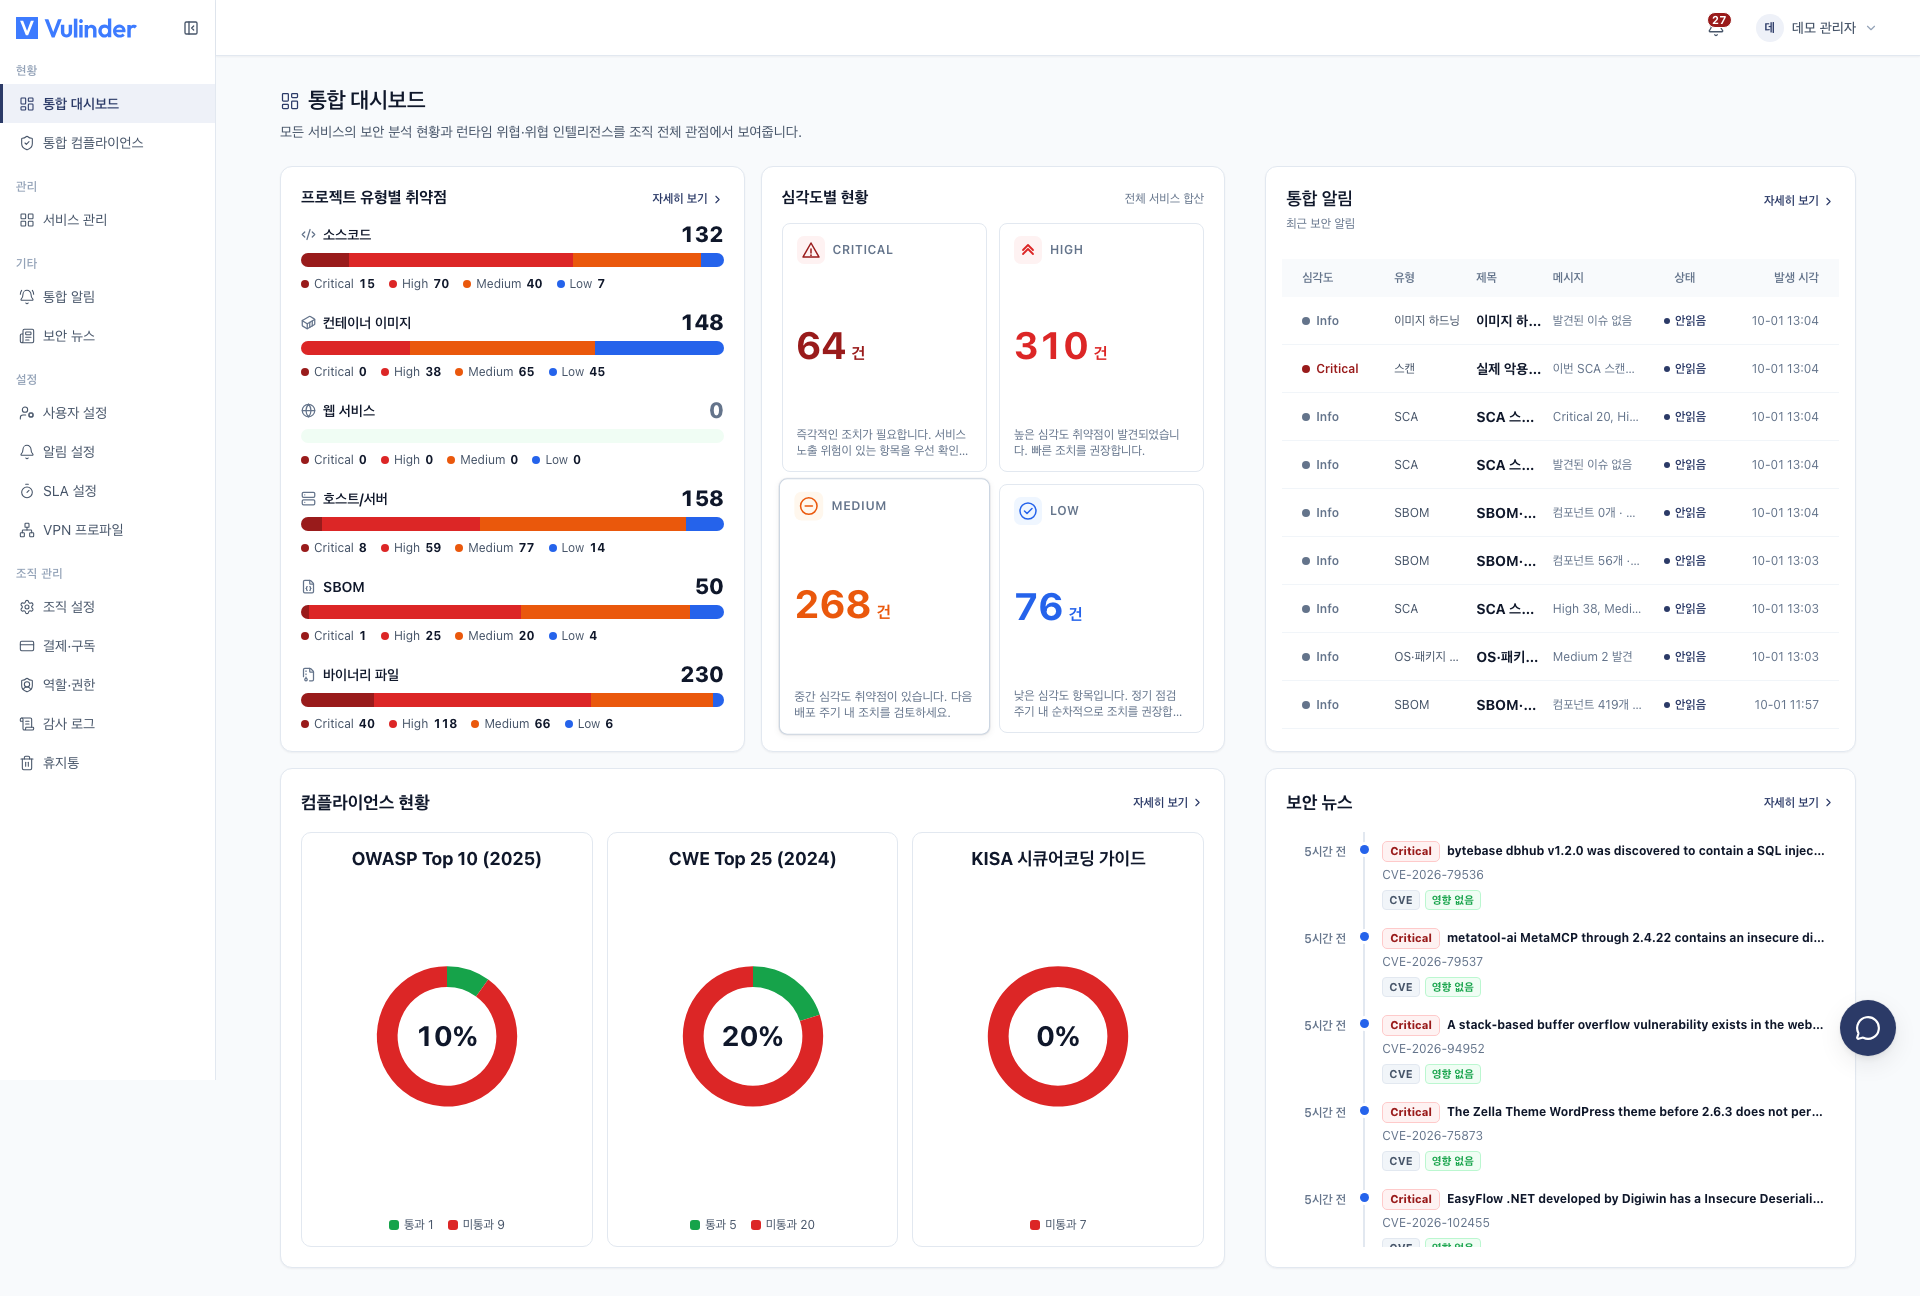
View security risk on one screen. It is the starting point for deciding what to look at first among scattered risks, so action usually starts here.
Unified dashboard and service dashboard
There are two dashboards depending on scope, and each has a layout suited to its scope.
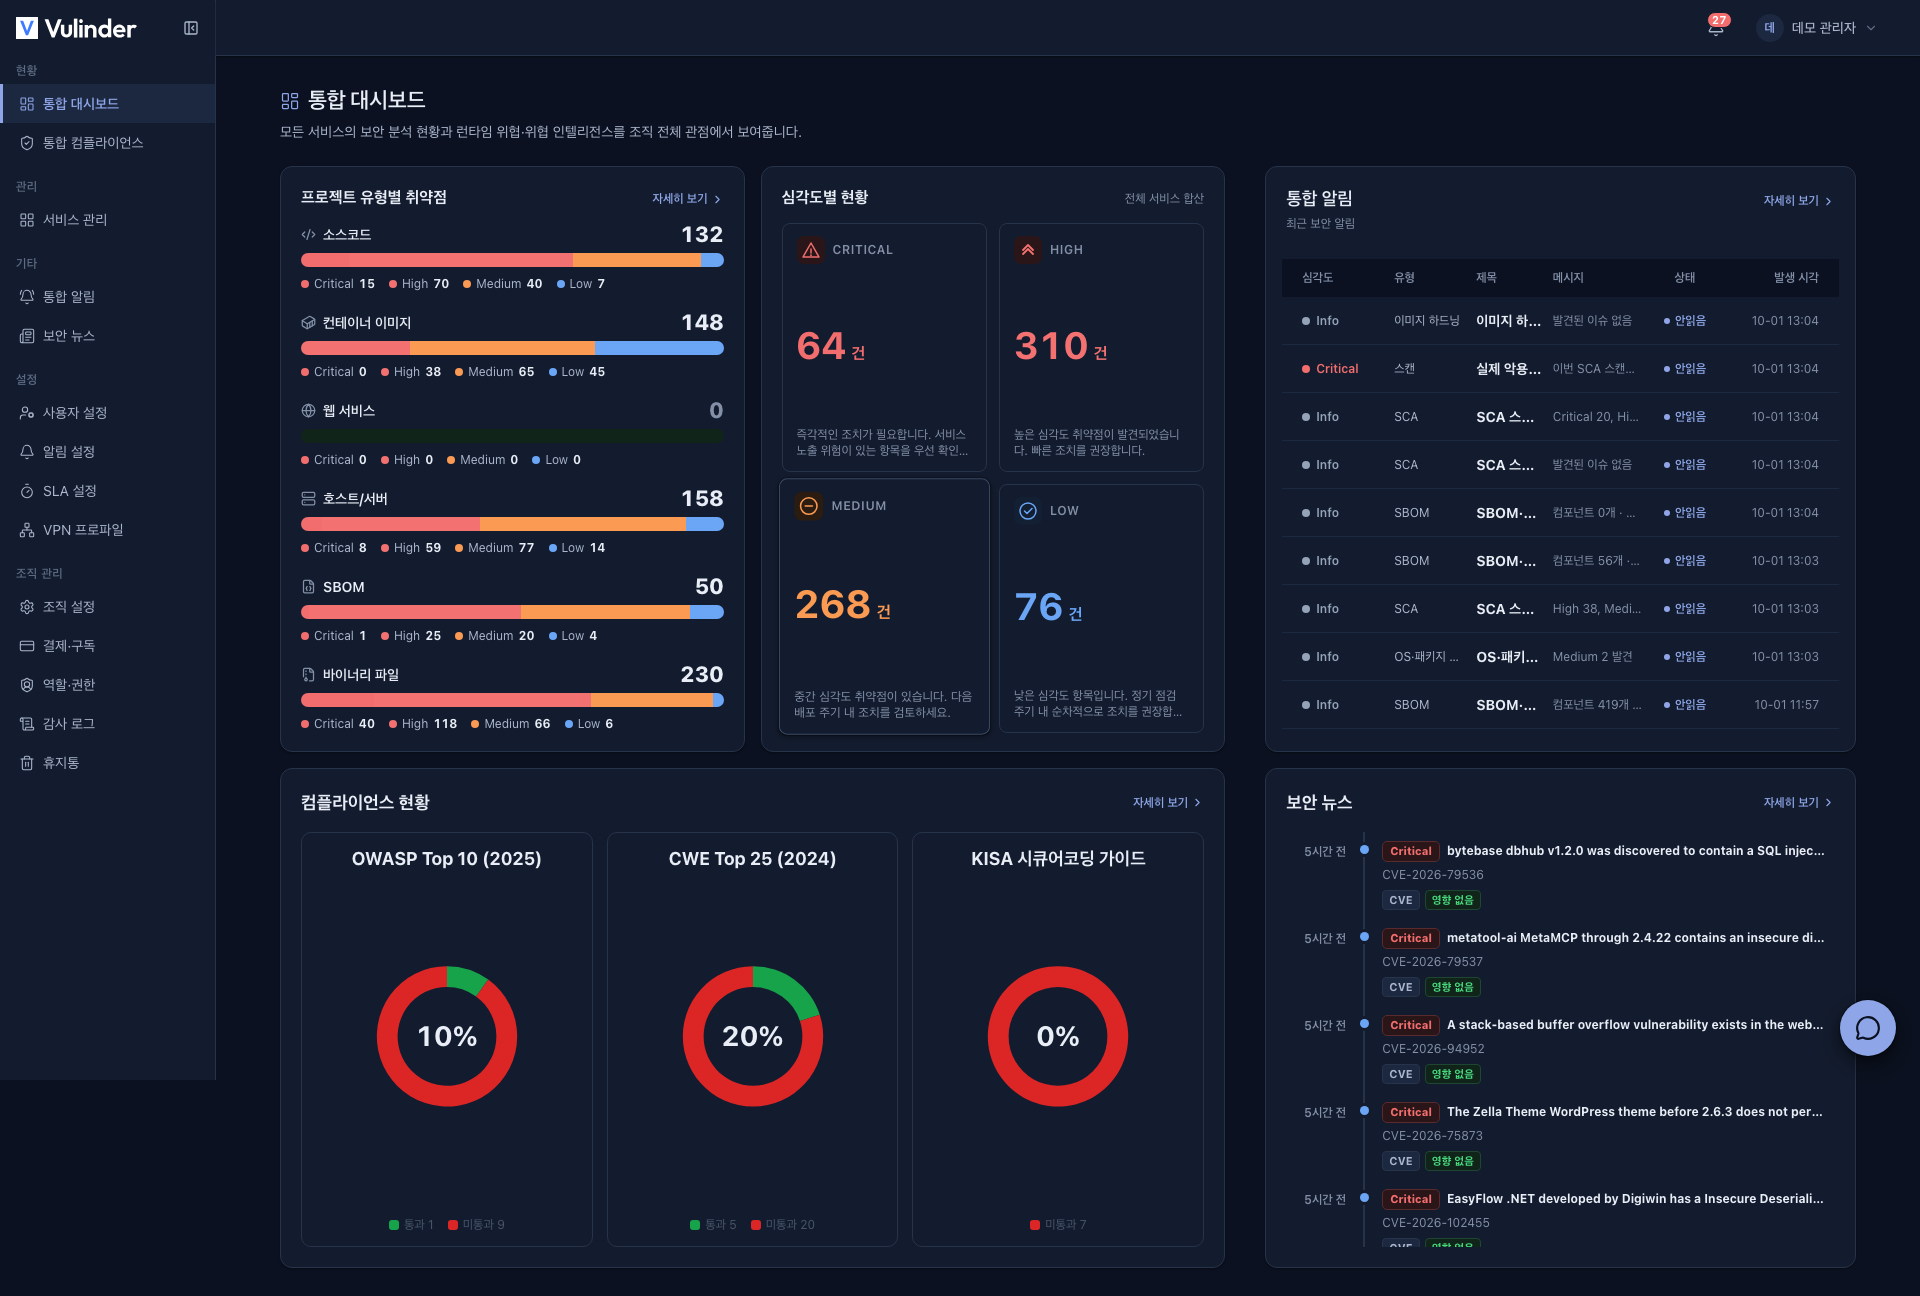
- Unified dashboard : combines every service in the organization to view the risk of the whole organization at the organization level.
- Layout : vulnerabilities by project type · status by severity · unified notifications · compliance · security news
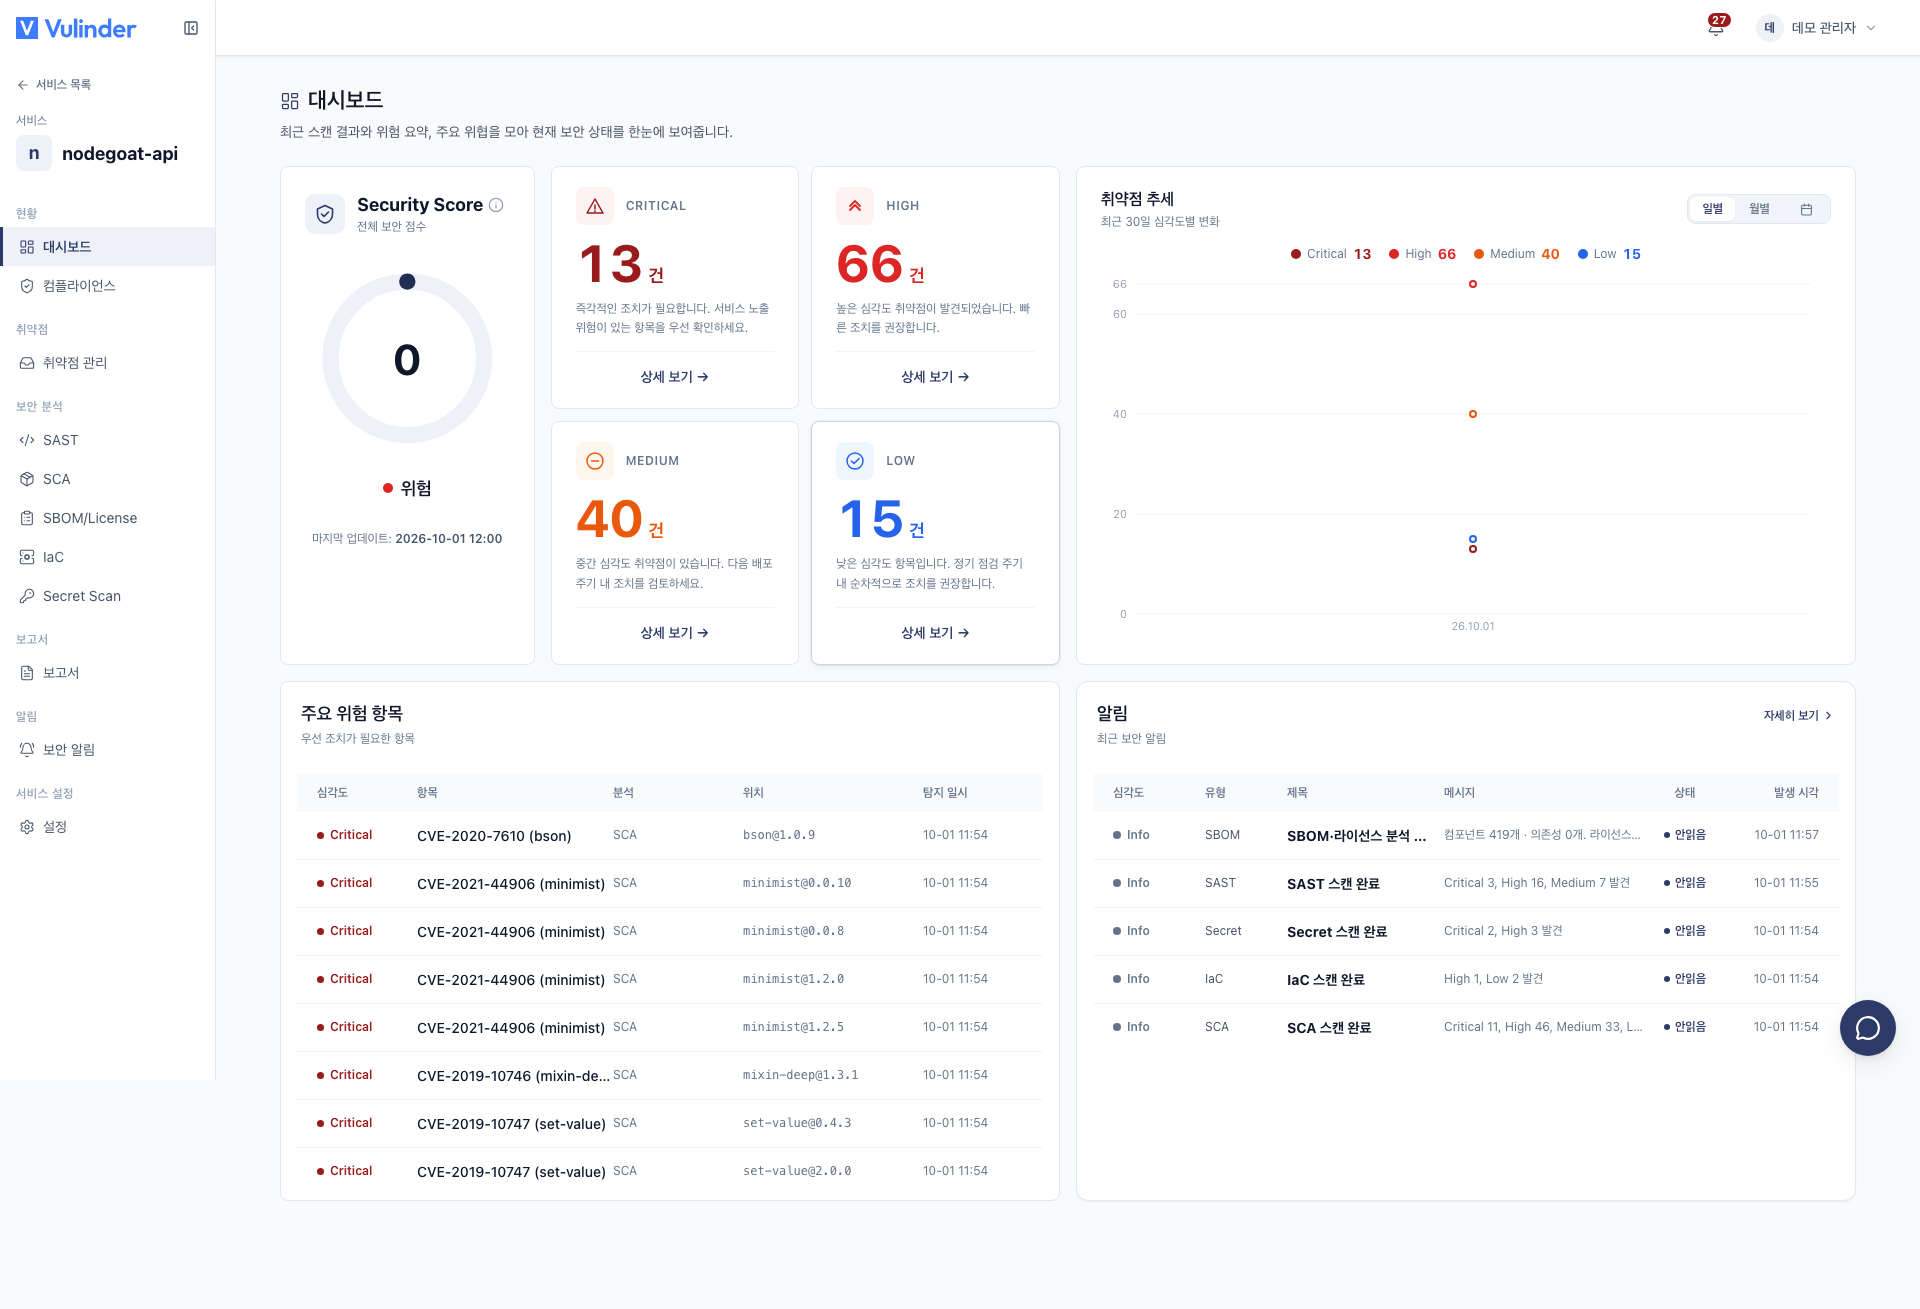
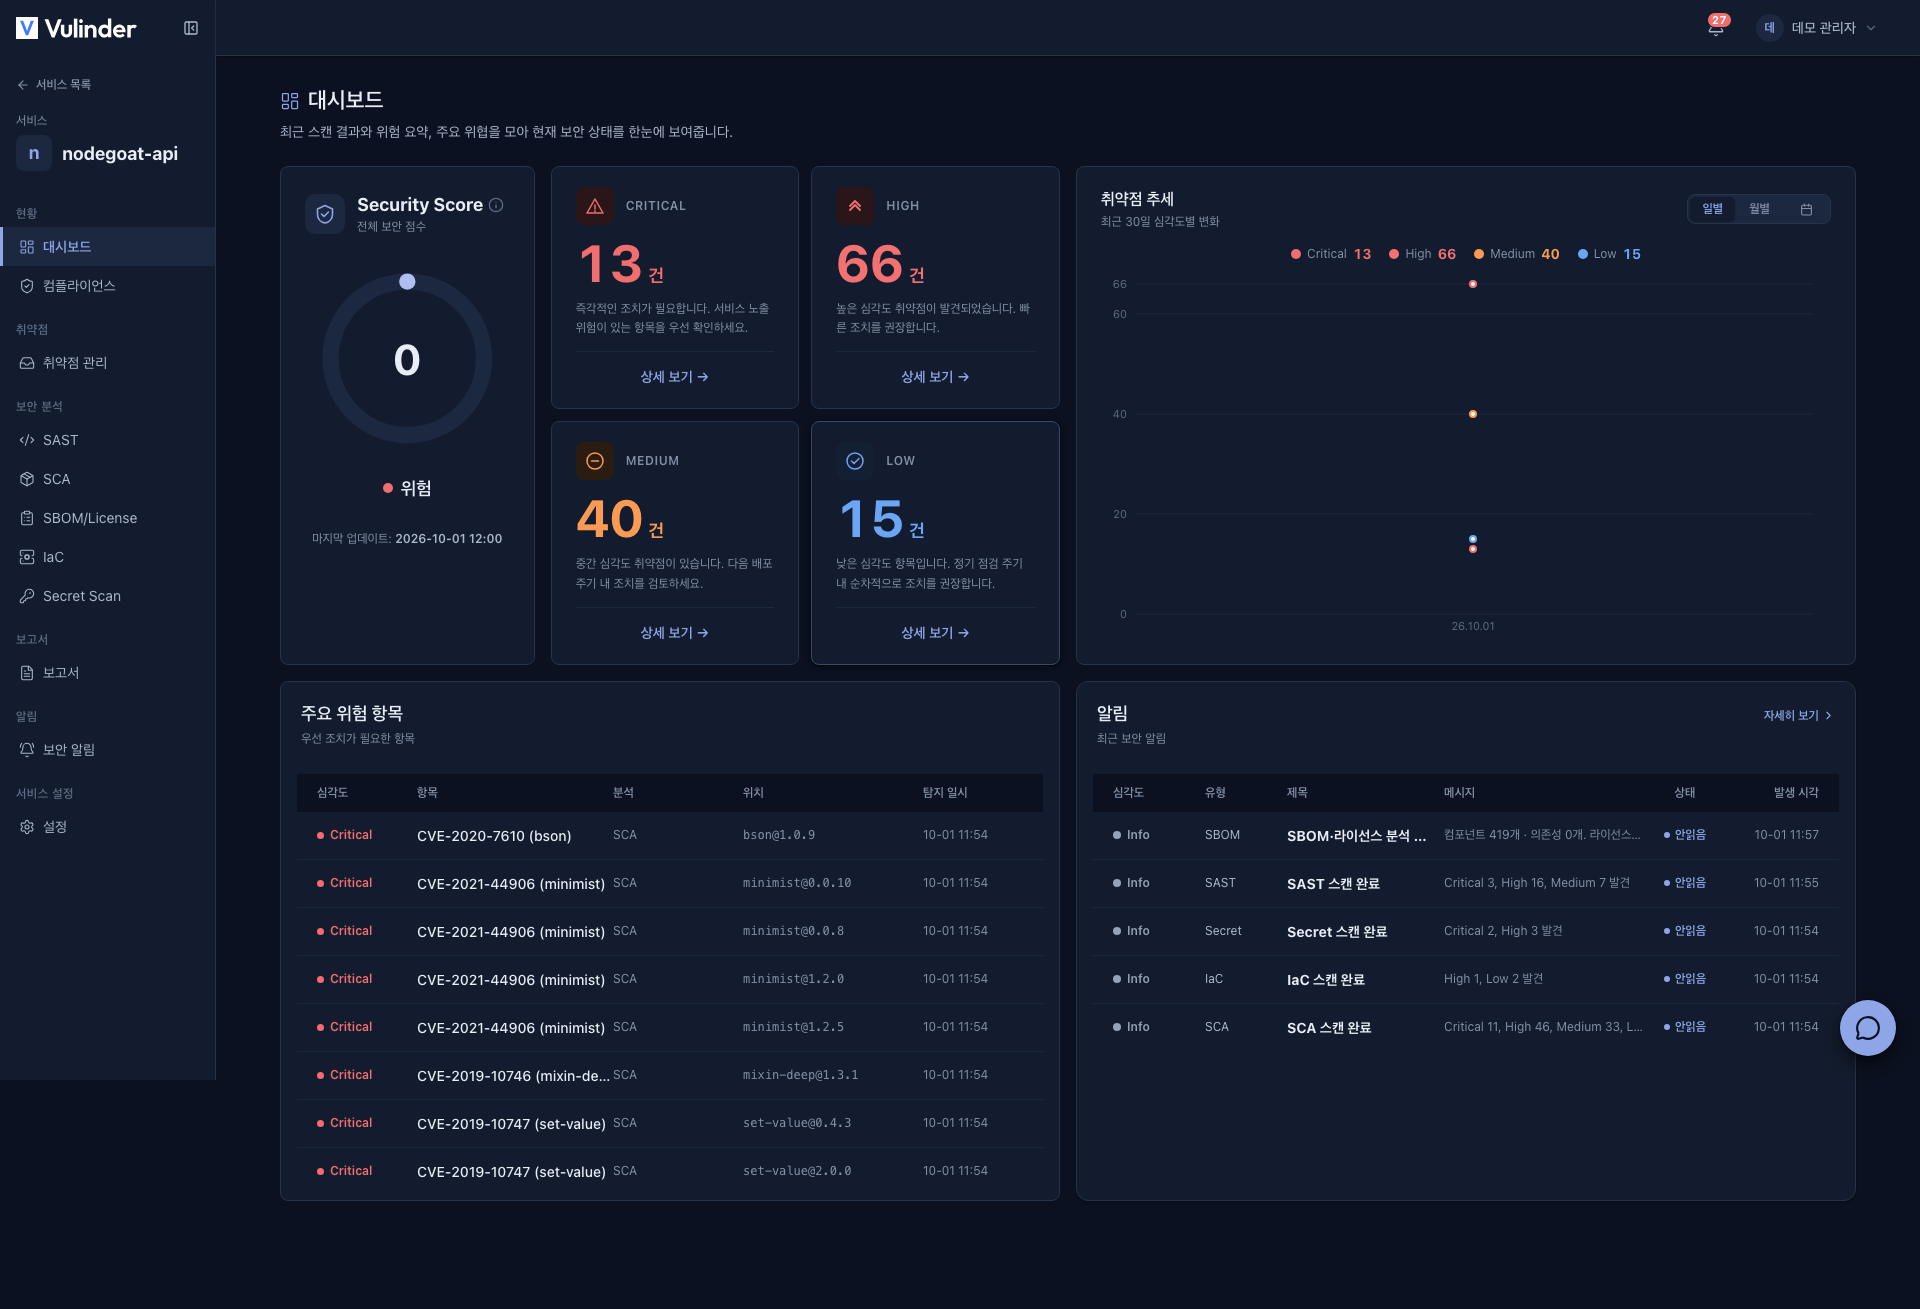
- Service dashboard : views the risk of a single specific service. It appears when you open a service.
- Layout : security score · severity summary · vulnerability trend · top risk items · notifications
What it shows
- Severity summary : the number of open (unhandled) findings by CRITICAL HIGH MEDIUM LOW . It goes down as you clean things up in Vulnerability Management.
- Top risk items (service dashboard) : the top risk items sorted by severity and KEV (under active exploitation). Click to open the detail.
- Breakdown by type : the unified dashboard also shows the vulnerability breakdown by service type. Per-service coverage and recent scan status are shown on the service list cards and the service dashboard.
- Recent activity : a feed of recent scan completions and notifications.
Not-measured state
A service that has never been scanned is marked as Not measured rather than "100 points". To keep you from mistaking an area you have not yet reviewed for a perfect score, the coverage indicator also tells you what has not yet been reviewed.
Click straight to the handling screen
Click a top risk item and the detail for that vulnerability opens right away. You move directly from the screen where you identified the risk to handling it.
Security score and posture
Aggregates found risk to express the security posture of the organization and service as a single metric. It ranges from 0 to 100, where higher is better.
- Deductions : Open findings deduct points by severity. Per item, Critical -25%, High -10%, Medium -3%, Low -0.5%, compounded multiplicatively.
- Excluded from deductions : Items handled as false positive or accepted risk
You can grasp the overall posture and direction of improvement without counting individual findings, and confirm the effect of your actions through trends over time.
- Score composition : combines the following results.
- Security analysis : code analysis · dependencies · web check · infrastructure as code · secrets
- Infrastructure checks : cluster · CIS · hardening
- SBOM inventory : newly found CVEs
- Vulnerability trend : a trend chart of finding counts by severity over time. You can switch the range between daily, monthly, and a selected date range to confirm the effect of your actions.
The fastest way to raise the score is to act first on items with high severity. KEV items carry a high real-world exploitation risk regardless of the score, so we recommend handling them first. Start from the top risk items above.
Related documents
- Vulnerability Management : Review and handle findings
- Compliance : Compliance status by standard